The Spend Map overlays customers spending patterns onto Microsoft Bing area maps. To view the map navigate to:
Workshop > Reporting > Spend Map from the side menu.
When you open the map the following screen will be displayed:
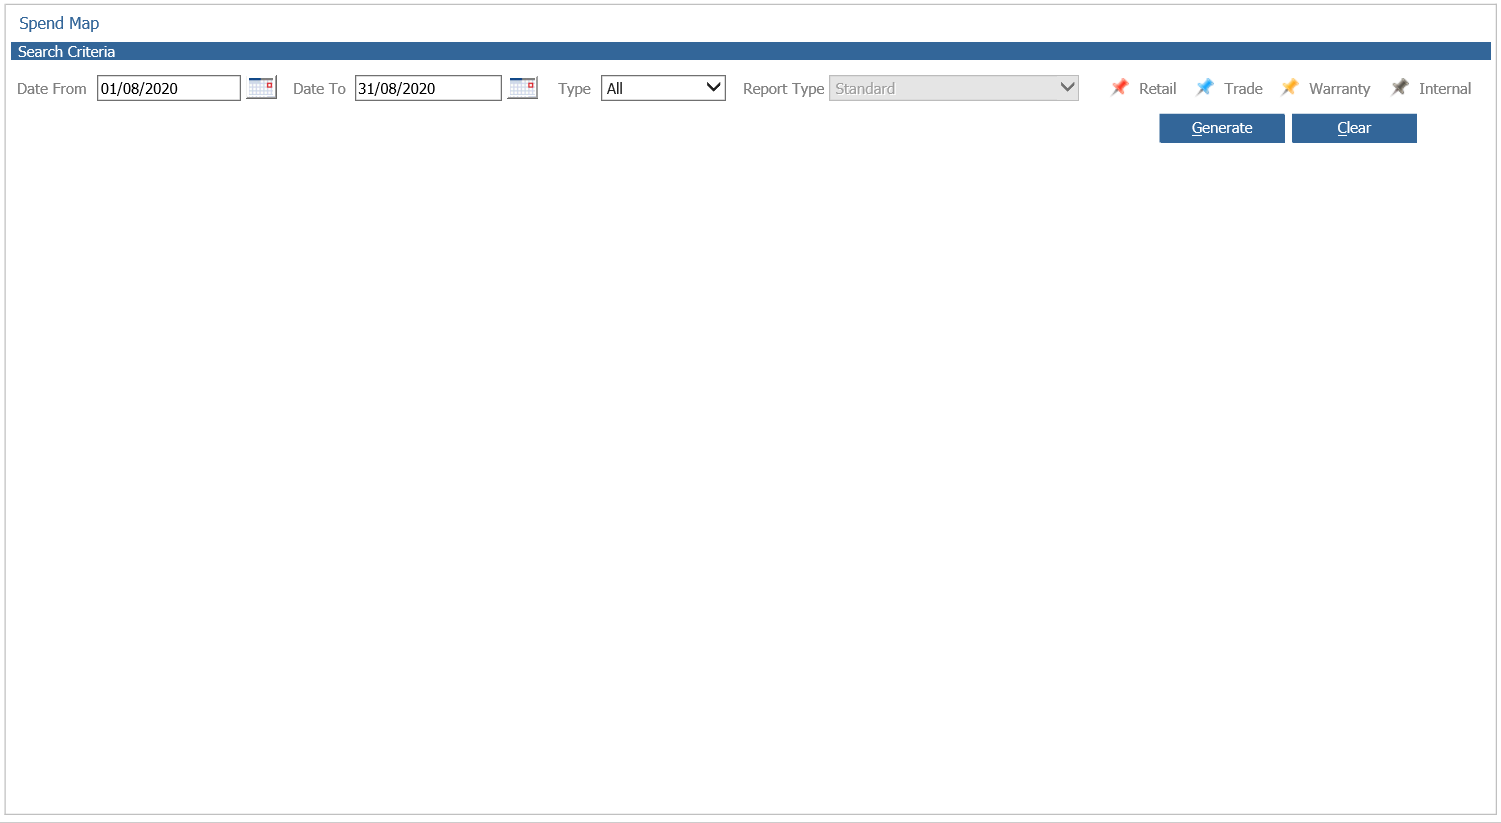
The report can be filtered by a date range and a spend type ie. Retail, Trade, Internal or Warranty.
The report can also display the number of sales by distance from the dealer or percentage of sales by selecting the appropriate option from the report type drop down menu.
The standard report type is displayed by default however, when either Sales Bands by Distance or Sales Bands by Percentage are selected, a visual representation of the default bandings (set within the vehicle module parameters) is overlaid on the map.
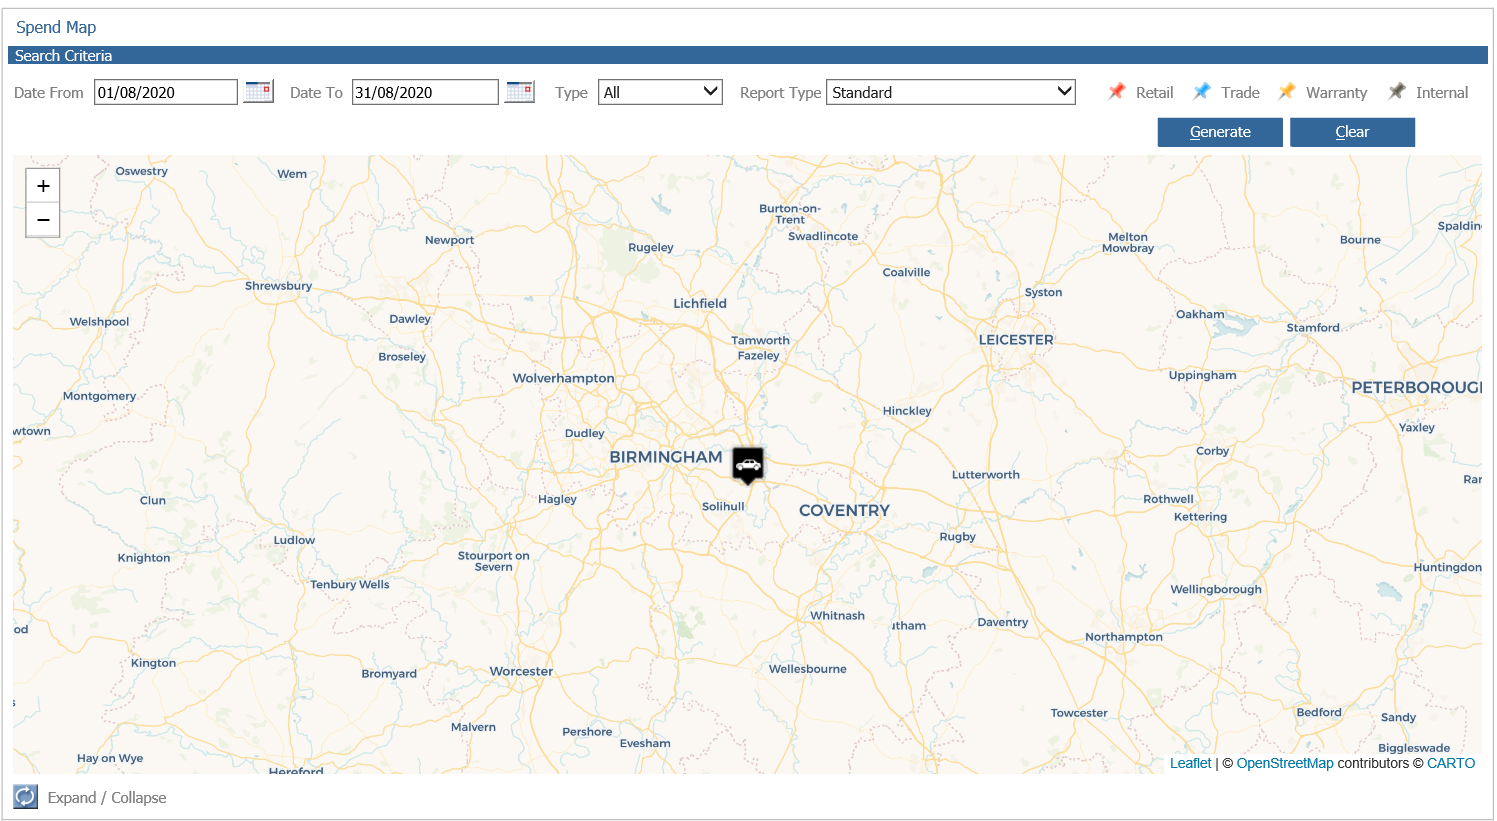
Once you have applied the relevant filters and have clicked 'Generate' the report will display as below:
Please Note: If the entered date range will generate too many points on the map, the system will warn you detailing the number of weeks the date range needs to be specified to, in order to enable the points to be drawn on the map.
The location of the dealership is indicated by the black arrow inset with a white car graphic: 
Customer invoices are illustrated by drawing pins on the map when a colour denotes the customer type:
- Red: Retail
- Blue: Trade
- Yellow: Warranty
- Black: Internal
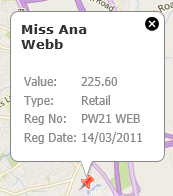
By hovering the mouse over the drawing pin icon, the following details will be displayed:
- The name of the customer
- The sales value of the invoice
- The vehicle registration number
- The vehicle registration date
Double clicking on a pin will display the 'Service Details' tab of the customer's CRM record, allowing you to view the service history, archived invoices and the customer's contact activity.