
The Lost Sales report shows details of vehicle lost sales at branch level. The report can be
generated as either Data or a graph.
From here, the lost sale groups can be drilled into to show the details of the lost sales within
those groups. If a Salesperson had been selected as the focus, the initial view will show the
total lost sales for each salesperson within the date range selected, which can then be drilled
into to show the detail.
Enter the parameters for the search (by default, the dates are set to be for the past month).
Select the report to focus on; either Lost Sale Group or Salesperson and whether a summary
or detailed report is required:
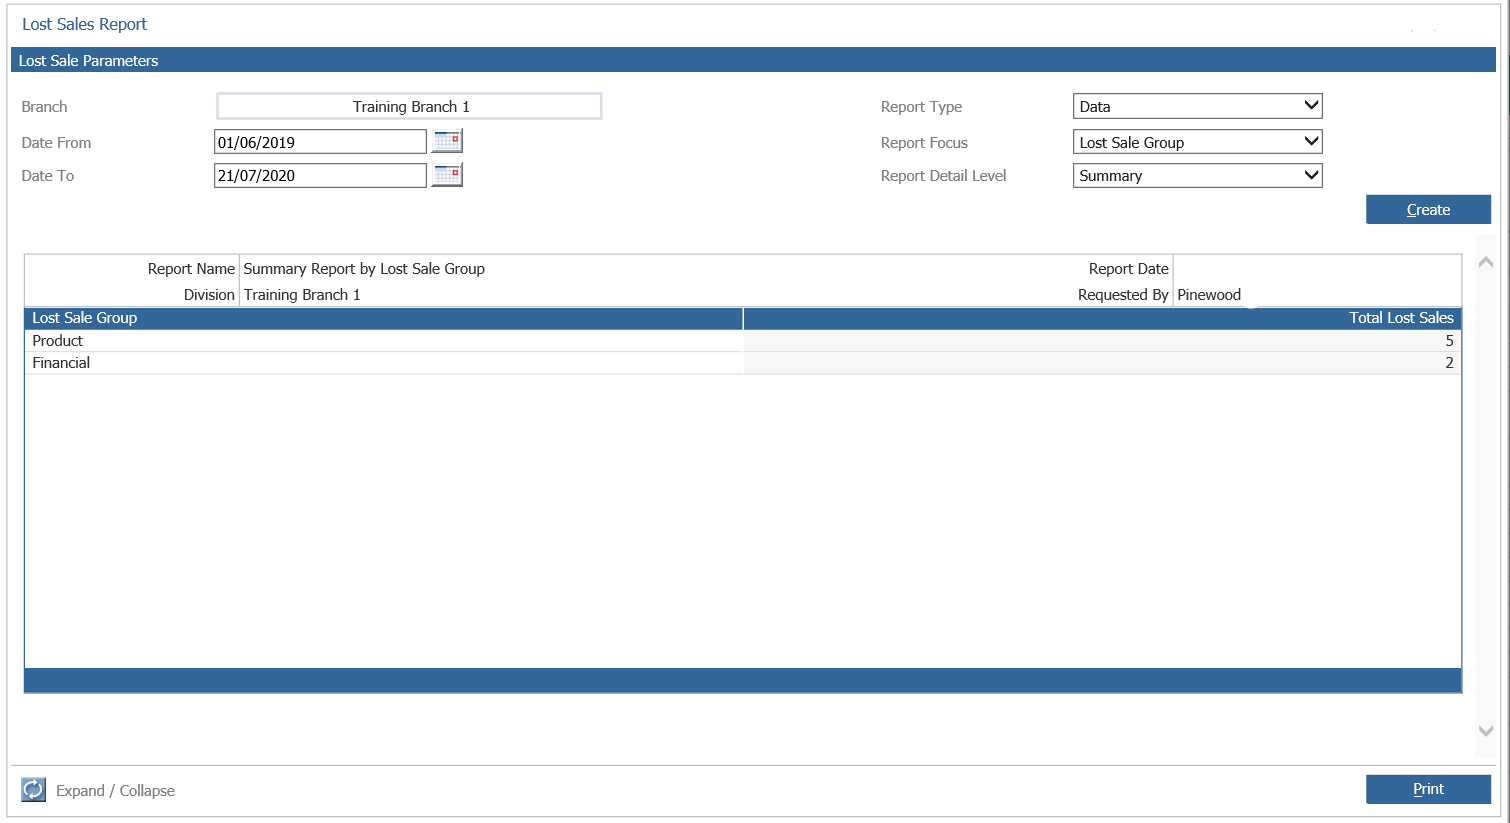
The report type drop down defaults to data, however a graphical version can be chosen, to
display the data as a pie chart.
The graph displays the percentages of the different lost sale reasons and can also display the
customer information by double clicking on a segment in the graph.